
May 4, 2023
Bear Market Rebound Looses Steam
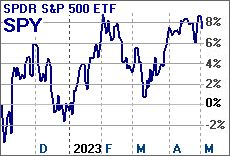
Days ago, First Republic Bank became the fourth bank to fail under the weight of long-term bond losses on their balance sheet as a direct result of the rapid interest rate hikes of the central banks in an aggressive fight against inflation. Thus far, although shareholders were wiped out, depositors of any amount were made whole by the FDIC. The actions taken quelled contagion fears of a bank run and led to a market rebound in late March and April due to hopes that it would mark the end of further interest rate hikes. However, in early May the Fed continued with another quarter percent hike as planned. During this period, the bear market rebound failed to make a new high and appears to be retreating, possibly indicating that the Fed’s agenda to slow the economy is taking root.
The recent market rebound has been criticized by technical traders as an artifact associated with only a few giga-cap tech companies and not representative of most stocks. Such divergences are often associated with a late market rally “fear of missing out” that may actually portend market weakness. Remain cautious.
StormGuardTM is On the Edge
Last month I said that I expected StormGuard would stay near its trigger threshold during April and would be ready to signal a change. The market appears to have held optimism that the Fed would pause their final interest rate hike in the wake of the recent bank failures, which would be considered particularly bullish for tech stocks. However, the Fed chose to continue its inflation-fighting agenda and raised rates, which sent the markets lower. In the days ahead, the market direction will likely depend more on the nature of corporate earnings reports.
StormGuard On Edge as Bear Rally Pauses
Quantitative Tightening
The classic definition of inflation is “too many dollars chasing too few goods.” In addition to the Fed’s interest rate hike tool for cooling the economy (which gets all the press), it can also inject or remove a portion of the money supply through the buying or selling of bonds. Part of the Fed’s inflation-fighting plan includes selling about $95B/mo. of bonds on its balance sheet for one or more years, as needed. The effect of their actions last year can be seen in the decline in the M3 money supply chart (next).

Inflation: Too Many Dollars Chasing Too Few Goods
Sticky Price Inflation
The Fed’s favorite measure of inflation excludes food and energy (chart: next) because they are often transitory and sometimes reverse in line with associated commodities. However, inflation of wages, services, and others generally do not reverse themselves. While the Fed is committed to seriously limiting inflation, they risk further bank failures and a wave of so-called zombie company failures when unable to pay higher rates as their loans renew.

Sticky Price Inflation Not Abating
Patience, not panic! Rules, not emotion!

May the markets be with us,
Disclaimers:
Investing involves risk. Principal loss is possible. A momentum strategy is not a guarantee of future performance. Nothing contained within this newsletter should be construed as an offer to sell or the solicitation of an offer to buy any security. Technical analysis and commentary are for general information only and do not constitute a personal recommendation or take into account the particular investment objectives, financial situations, or needs of any individual. Before investing, carefully consider a fund’s investment objectives, risks, charges and expenses, and possibly seeking professional advice. Obtain a prospectus containing this and other important fund information and read it carefully. SumGrowth Strategies is a Signal Provider for its SectorSurfer and AlphaDroid subscription services and is an Index Provider for funds sponsored by Merlyn.AI Corporation. SumGrowth Strategies provides no personalized financial investment advice specific to anyone’s life situation, and is not a registered investment advisor.