
Oct. 6, 2023
September’s Problems Weigh Heavily
During September, markets pulled back from their summer highs (fueled by a bubbly love affair with AI-futures) while new inflationary pressures emerged, including sharply rebounding oil prices and higher wage demands from striking UAW automotive employees, striking Kaiser Permanente healthcare workers, and pending strikes by the Las Vegas Culinary and Bartenders Union, the Los Angeles Service Employees International Union, and the American Airlines flight attendants union. Meanwhile, Congressional dysfunction over budget priorities and deficits has led to temporary government funding measures and a vote to vacate (fire) the Speaker of the House – both of which weigh heavily on credit rating agencies as they consider downgrading US debt.
Other than that, the economy and employment still appear to be strong. Oh – but doesn’t that create a case of “good news is bad news.” Continuing strong business activity implies that the Fed must work even harder to quell inflation by slowing down the economy. Thus, they will keep interest rates “higher for longer” and pull more liquidity out of the economy (quantitative tightening) – resulting in lower personal and business spending, lower sales, lower earnings, and thus lower valuations/prices for stocks. A thought to ponder: Will the Fed handle the depth and duration of a recession with the same proficiency demonstrated in their handling of inflation?
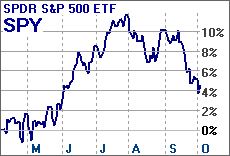
6 Months
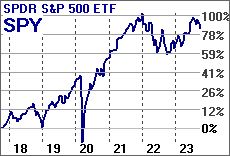
6 Years
StormGuardTM Has Decisively Triggered
StormGuard reflects what investors are already doing, and are likely to continue doing. StormGuard began its sharp downward move in August and it only picked up steam in September, seeming to confirm that the market’s recent runup was simply part of an extended bear market rally supported by excess Covid liquidity, and not the start of a new secular bull market.

StormGuard Triggers – A Bear Market is Indicated
Value Sentiment Divergence
The Value Sentiment Indicator is one of three components that can trigger StormGuard. It weighs the relative number of new highs and new lows each market day to ascertain a change in investor behavior. This indicator recently firmly turned negative, indicating a serious deterioration in investor sentiment. The Institutional Momentum indicator is also a component that can trigger StormGuard. It evaluates the relative importance of price moves based on trading volume. Moves with higher volume generally indicate how the whales evaluate the market. The Institutional Momentum indicator is poised to soon go negative as well, further indicating that it is time to head for safety with defensive funds – automatically selected by your Strategies that incorporate an integrated Bear Market Strategy.
Value Sentiment Indicator

Institutional Momentum Indicator

Anatomy of a Bubble
A classic market bubble is triggered by an attention getting event, fueled by momentum, and driven by emotion. Everyone loves getting in on something with great upward momentum until valuations get too high and the upward trend stops and a few folks start booking profits and everything unwinds with negative momentum. Given the excessive valuations of many technology firms it may be that we are at the place marked in purple on the chart. That said, keep in mind that elections, congress, other bubbles, and major world events can interrupt and overtake a particular bubble. As investors, we know that there are no guarantees, and that the game is one of improving the odds of being on the right side of the trade versus the wrong end of a bubble.

Anatomy of a Bubble
Inverted Yield Curve Trouble
The bond Yield Curve is said to be inverted when short-term interest rates are higher than long-term rates. An inverted yield curve has been a reliable indicator that a recession will soon follow. Note that a recession tends to follow an inversion. When the inversion ends it is because longer term bond yields increase to reflect that the bond market now believes higher rates from the Fed (a sign of trouble) will be around for much longer than a short while.

Inverted Yield Curve – Trouble
Long Policy Lags
In this table from First Trust, the columns show the dates when previous yield curve inversions occurred, when the triggered recession occurred, and the lag-days between inversion and recession. The information in the orange cells shows how long of a lag it has been since the last yield curve inversion and how it compares with the policy lag for other recessions. What the table shows is that this lag is not out of the ordinary as it is still shorter than average by at least a few months.
Long and Variable Policy Lags
![]()
Market Data
| 2-yr/10-yr US Yield Curve Inversion Date | 3-mo/10-yr US Yield Curve Inversion Date | Recession Following Inversion | Days Since 2-yr/10-yr US Yield Curve Inversion | Days Since 3-mo/10-yr US Yield Curve Inversion |
|---|---|---|---|---|
| 8/17/1973 | 12/15/1978 | Jan 1980 – Jul 1980 | 502 | 382 |
| 9/11/1980 | 10/27/1980 | Jul 1981 – Nov 1982 | 293 | 247 |
| 1/5/1989 | 5/24/1989 | Jul 1990 – Mar 1991 | 542 | 403 |
| 2/11/2000 | 7/18/2000 | Mar 2001 – Nov 2001 | 384 | 226 |
| 1/31/2006 | 7/19/2006 | Dec 2007 – Jun 2009 | 669 | 500 |
| 7/5/2022 | 11/8/2022 | TBD | 422* | 296* |
| Mean | 478 | 352 | ||
| *Measures the time since inversion | Median | 502 | 382 | |
New Video: Momentum Dual Defense
Two Guard Dogs Are Better! While StormGuard™ is the first line of defense when market momentum fails, TrendGuard™ acts as a second line of defense by further incorporating a Defensive Backstop Model to compete directly for momentum leadership with the Model Portfolio’s candidate funds in order to provide a performance floor in the event that the candidate funds begin performing poorly separate from the broader market. Dual Defense™ assesses safety in two different ways: It’s like having a guard dog at the front door and a guard dog at the back door.
Patience, not panic! Rules, not emotion!

May the markets be with us,
Disclaimers:
Investing involves risk. Principal loss is possible. A momentum strategy is not a guarantee of future performance. Nothing contained within this newsletter should be construed as an offer to sell or the solicitation of an offer to buy any security. Technical analysis and commentary are for general information only and do not constitute a personal recommendation or take into account the particular investment objectives, financial situations, or needs of any individual. Before investing, carefully consider a fund’s investment objectives, risks, charges and expenses, and possibly seeking professional advice. Obtain a prospectus containing this and other important fund information and read it carefully. SumGrowth Strategies is a Signal Provider for its SectorSurfer and AlphaDroid subscription services and is an Index Provider for funds sponsored by Merlyn.AI Corporation. SumGrowth Strategies provides no personalized financial investment advice specific to anyone’s life situation, and is not a registered investment advisor.