
Dec. 8, 2022
Overview: Nerves of Steel
The bottom line issue is whether the inflation-recession story is getting better or worse. In November investors pushed the bear market rally a bit higher on the belief that the Fed’s December rate hike might be only 0.5% even though the Fed also indicated rates may have to go higher for a longer period. The market is currently “testing resistance” for breaking through both its 20-day moving average and its downward highs/lows channel – and so far has failed.
The optimists believe that resilience in employment and consumer spending will drive the market through the resistance on the way to a worthy rebound. The pessimists know that the Fed is on a mission to tame inflation – defined as too much money chasing too few goods. Thus, the Fed will drive excess liquidity from the economy by raising rates until painful broad economic stress tames inflation. The Fed has been clear about this – that’s where they are taking us. They are committed to stopping inflation in its tracks rather than being timid and allowing stagflation to take root.
This is also the formula for inducing a serious capitulation crash fueled by margin calls and the threat of many low-interest debt-financed investments collapsing globally. The good news is that quality bonds and Treasuries generally shine as the Fed pauses and reverses most of its rate hikes. The story continues in the charts below. Stay Buckled Up and “Don’t fight the Fed.”
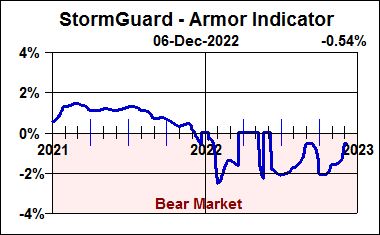
StormGuard Remains Pessimistic
Our StormGuard indicator remains firmly negative. Although it recently turned upward in response to the October and November bear market rally, the market decline in the first week of December has halted its rise.
As reported this week by Nasdaq, “Big Commerce merchants not only weathered the macroeconomic storm but flourished this Cyber Week, with 32% YoY growth in gross merchandise value compared to 2021.” Additionally, U.S.News reports “The November employment report the government issued Friday was no exception. Employers added 263,000 jobs — a substantial gain that was far above economists’ expectations. Wages rose robustly, too, further intensifying the inflationary pressures the Fed has been struggling to contain.”
The economy is in a situation where good news is bad news – indicating that it may be too early for the Fed to start moderating its hawkish 0.75% rate hikes. We will know next week. Stay Buckled Up.

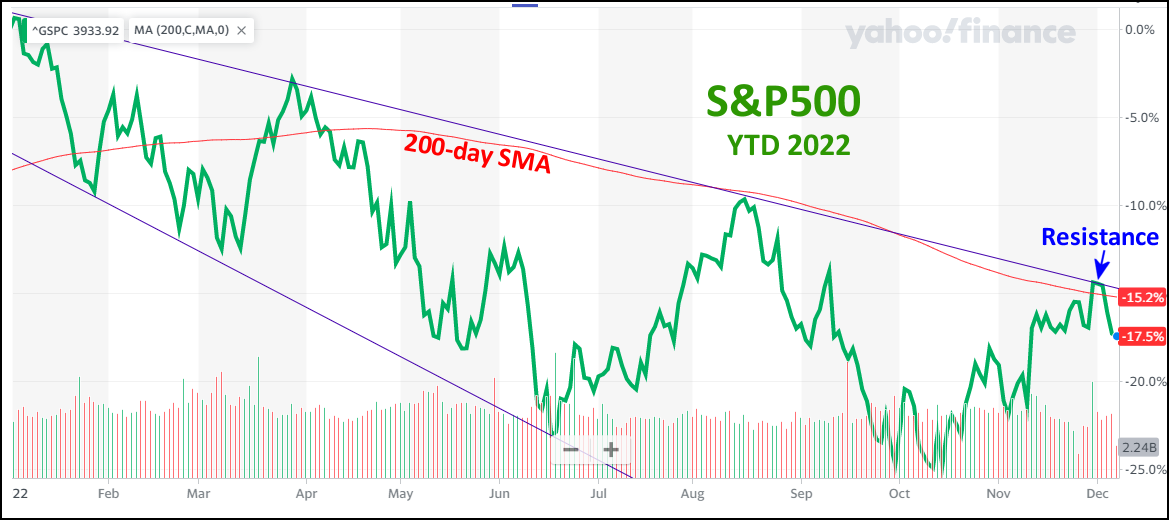
Is Resistance Futile?
In the chart of the YTD performance of the S&P500 (below), the investors are testing two measures of psychological resistance. While there is no fundamental basis in either of them, they are meaningful because belief in them results in a self-fulfilling prophecy. For the moment, the S&P500 failed to break through either its 200-day moving average or the resistance line drawn along its descending highs. While these technical resistance barriers could be re-tested in the coming days, we believe that pressure to the downside will prevail.
Testing Technical Resistance in Two Ways
Still Tracking the 2008 Crash
In the chart below, the 2022 YTD S&P500 performance (orange) is correspondingly overlaid on the 2008 bear market (black) – both starting from their prior market highs. Given that the Fed intends to keep raising rates until the excesses buckle, there will almost certainly be another leg down. Bear markets of this magnitude generally end with fearful seller capitulation, which is yet to occur.
“History Doesn’t Repeat Itself, But It Does Rhyme.” Mark Twain

A Buffett Indicator Variant
If the tech bubble of 2000 was a remarkable blowoff top, then the QE bubble of 2022 certainly qualifies as a stunning blowoff top. The chart (below) compares the market value to GDP (gross domestic product). Before 2010 the average value is about 75%. Today (after the market’s decline in 2022) the value is still twice the 40-year average through 2010. This was made possible by persistently low interest rates that directly affect PE multiples. For this reason alone, there is room for stocks to lose another 50% before this bear market is over.

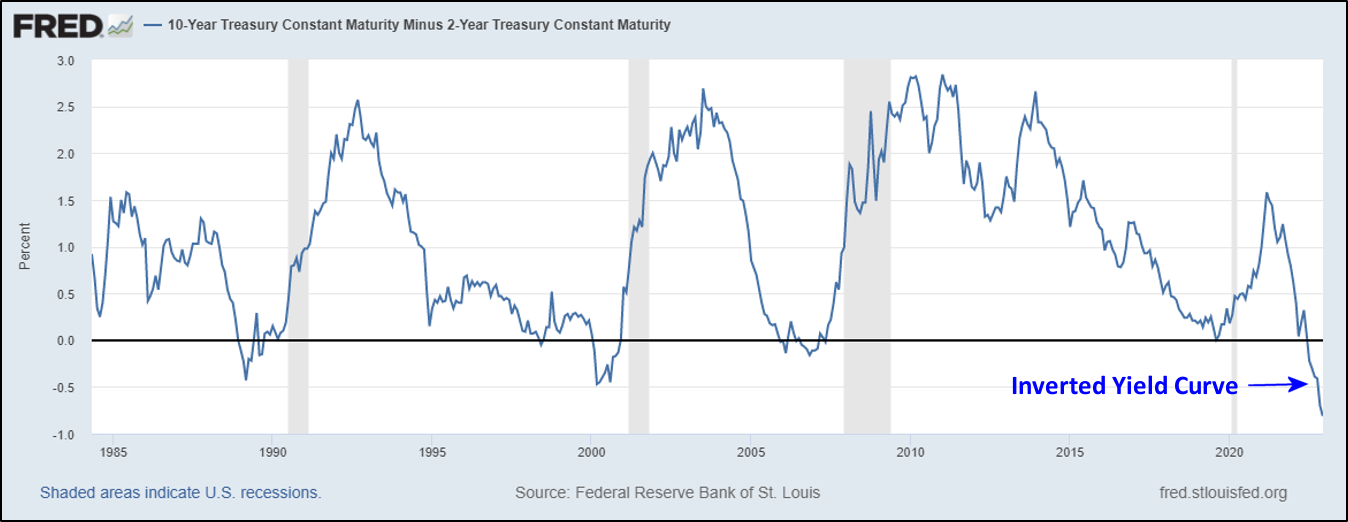
The Bond Inverted Yield Curve
The difference between 10-year and 2-year bond yields is widely known as “The Inverted Yield Curve.” In a healthy bull market, longer-term bonds have higher yields because there is greater uncertainty ten years from now than there is two years from now. When that relationship inverts (goes negative on the chart) it is a sign that near-term disruption of the economy is expected. The shaded areas on the curve indicate U.S. recessions triggered by those disruptions. It appears that the Grinch is preparing to steal Christmas!
The Most Anticipated Recession Ever
Perhaps it’s the most anticipated because there is little doubt about its cause and cure. The governmental response to the Covid-19 epidemic included flooding the global economy with many $Trillions in liquidity. Inflation is the understood result. Since early 2022 the Fed has made clear its plan for rapid and steady rate increases through 2022 and into 2023. They have been executing like clockwork, and the consequences of the promised pain have been sinking in. Stay Buckled Up.

Merlyn.AI Closes its BOB and SNUG ETFs
On November 23, 2020 Merlyn.AI closed its BOB and SNUG ETFs. Each year about 130 ETFs close primarily for failure to garner sufficient AUM (assets under management) to make them financially viable. With nearly 3,000 ETFs on the market, competition for worthy ideas is stiff – nearly half of all launched ETFs eventually close. It is believed that BOB suffered from being “a distinction without a difference” relative to its siblings, and SNUG suffered primarily from an identity crisis – intended for conservative investors but named “Tactical Growth and Income.”
SNUG Index to be Retooled as “Tactical Risk Mitigation Index”
The new Tactical Risk Mitigation index was described in November’s Newsletter and described in detail in the November Meetup Webinar. We would really appreciate your comments on the Tactical Risk Mitigation Index and your thoughts about formally relaunching it. Thanks in advance for your valuable comments.
Patience, not panic! Rules, not emotion!

May the markets be with us,
Disclaimers:
Investing involves risk. Principal loss is possible. A momentum strategy is not a guarantee of future performance. Nothing contained within this newsletter should be construed as an offer to sell or the solicitation of an offer to buy any security. Technical analysis and commentary are for general information only and do not constitute a personal recommendation or take into account the particular investment objectives, financial situations, or needs of any individual. Before investing, carefully consider a fund’s investment objectives, risks, charges and expenses, and possibly seeking professional advice. Obtain a prospectus containing this and other important fund information and read it carefully. SumGrowth Strategies is a Signal Provider for its SectorSurfer and AlphaDroid subscription services and is an Index Provider for funds sponsored by Merlyn.AI Corporation. SumGrowth Strategies provides no personalized financial investment advice specific to anyone’s life situation, and is not a registered investment advisor.