
Jan. 5, 2022
Overview
In the New Year, StormGuard remains triggered. The key factors driving the markets include:
- The second bear market rally (Oct-Nov) failed with a 5.8% decline in December.
- The Fed shows no sign of pivoting away from its aggressive rate hike plan.
- Congress just passed an additional $1.7 trillion spending bill, exacerbating inflation.
- Although the tax-loss selling season is over, losses on Jan 3rd suggest no New Year magic.
- Technical investors require volatility of VIX > 40 to say the bottom is in. And it is not.
- Earnings downgrades have outpaced earnings upgrades over the last six months.
The Fed confirmed that it intends to drive excess liquidity from the economy by raising rates until painful broad economic stress tames inflation. The Fed has been clear about this – that’s where they are taking us. They are committed to stopping inflation in its tracks rather than being timid and allowing stagflation to take root as it did in the 1970s. Unfortunately, this plan will also likely induce a serious capitulation crash fueled by margin calls and the threat of low-interest debt-financed investments collapsing.
The good news is that when the Fed pivots and reverses most of its prior rate hikes, bonds and Treasuries will begin to shine again and provide attractive alternatives to the ultra-short-term bonds and inverse equity funds that were predominantly selected as momentum leaders this month. Furthermore, we recently reviewed our many Bear Market Strategy configurations to ensure they have a sufficiently diverse set of candidate funds to behave well in this environment where bonds have become correlated with equities. Stay Buckled Up and “Don’t fight the Fed.”
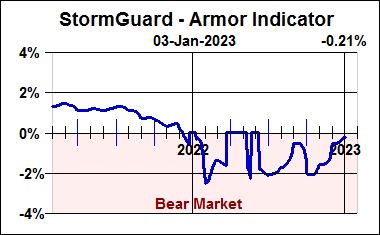
StormGuard Remains Pessimistic
Our StormGuard indicator remains firmly negative. Although it turned up sharply in response to the Oct-Nov bear market rally, the market’s subsequent decline in December significantly slowed its rise. Among its three main constituents (Price Trend, Institutional Momentum, and Value-Sentiment), two are now negative and declining. Thus, StormGuard remains triggered.
Where to from here? Arthur Motley once observed, “If the nation’s economists were laid end-to-end, they would point in all directions.” Given the utter failure of seasoned professionals to predict the poor market performance of 2022, it’s hard to give much credence to those same professionals with rosy projections for 2023. There are numerous significant unknowns, including the path of the Russian/Ukraine war, whether there will be a winter energy squeeze in Europe, how the massive Covid outbreak in China will play out, will the Fed again over-play its hand and break something, and how much more punishment investors will take before a capitulation selloff is triggered?
Fortunately, the markets are not completely random. Momentum and technical analysis are about improving investment performance by tilting selection odds in our favor. Stay Defensively Buckled Up.

Still Tracking the 2008 Crash
In this chart (shown next), the S&P500’s 2008-2009 market crash (in red) is overlaid on the S&P500’s 2022 market crash (in green) with their market highs aligned. Although the comparison is ominous, it will not necessarily repeat itself. However, similar patterns of investor behavior also occurred during the market crashes of 2002, 1975, and others. While today’s facts and circumstances are a bit different, how investors react to them is at least somewhat baked into our genes.
Similarities to the 2008-2009 Crash Continue
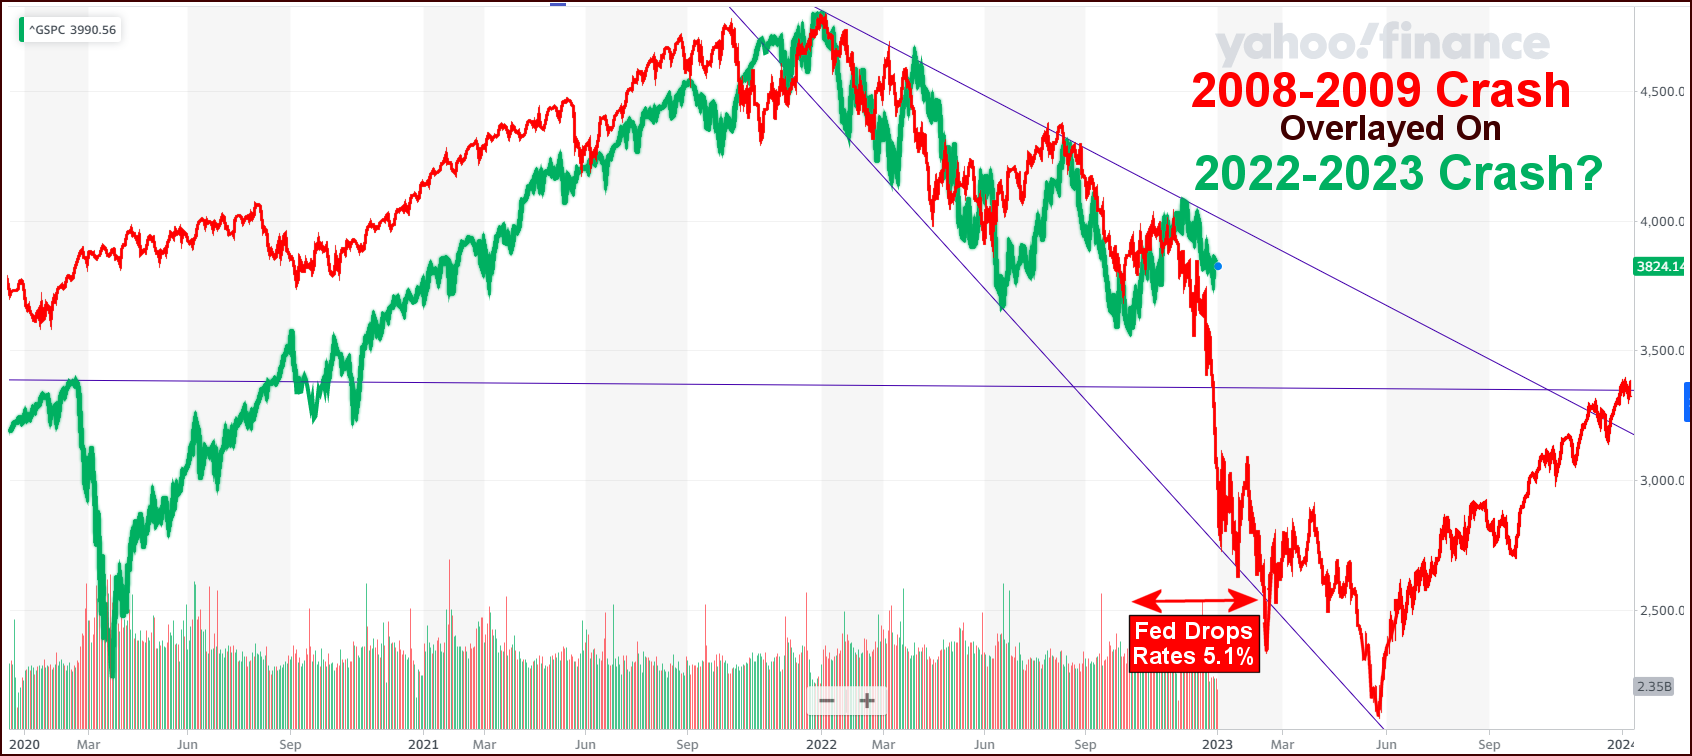
Of at least equal importance is whether the Fed will do something different this time. Marked on the chart is a period over which the Fed quickly reduced interest rates by 5.1%, which proved to be an insufficient stimulus to prevent a sharp, emotional capitulation selloff. It appears that a “hard landing” may have a mind of its own.

May the markets be with us,
Disclaimers:
Investing involves risk. Principal loss is possible. A momentum strategy is not a guarantee of future performance. Nothing contained within this newsletter should be construed as an offer to sell or the solicitation of an offer to buy any security. Technical analysis and commentary are for general information only and do not constitute a personal recommendation or take into account the particular investment objectives, financial situations, or needs of any individual. Before investing, carefully consider a fund’s investment objectives, risks, charges and expenses, and possibly seeking professional advice. Obtain a prospectus containing this and other important fund information and read it carefully. SumGrowth Strategies is a Signal Provider for its SectorSurfer and AlphaDroid subscription services and is an Index Provider for funds sponsored by Merlyn.AI Corporation. SumGrowth Strategies provides no personalized financial investment advice specific to anyone’s life situation, and is not a registered investment advisor.